Multichannel VLF SID Receiver
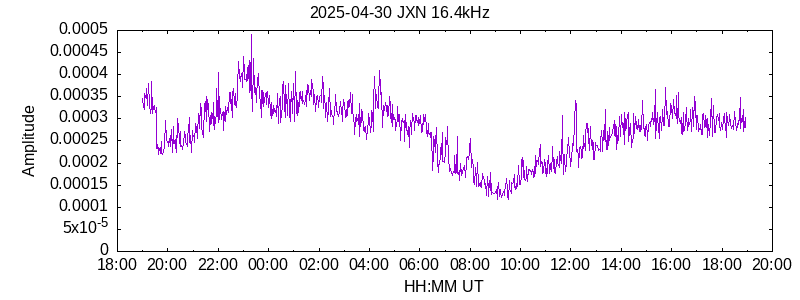
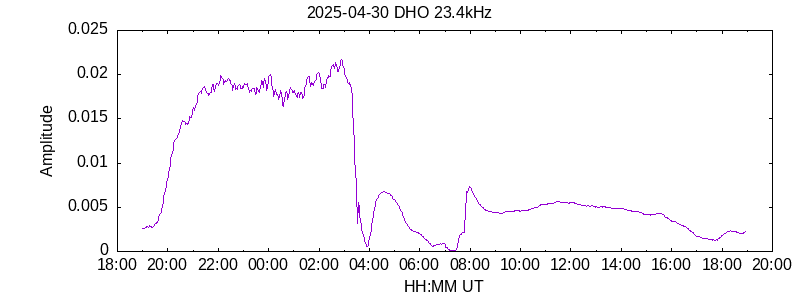
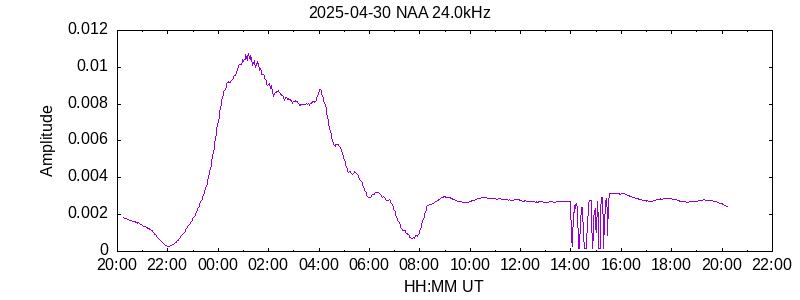
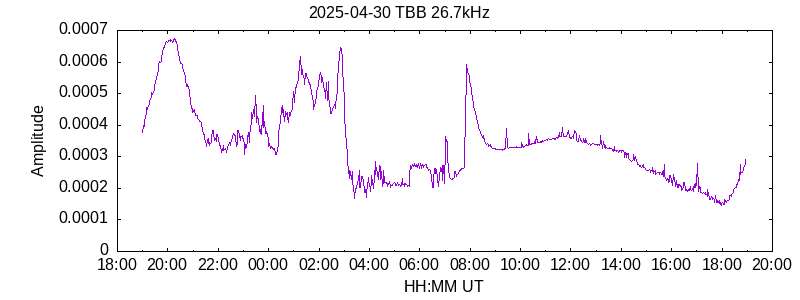
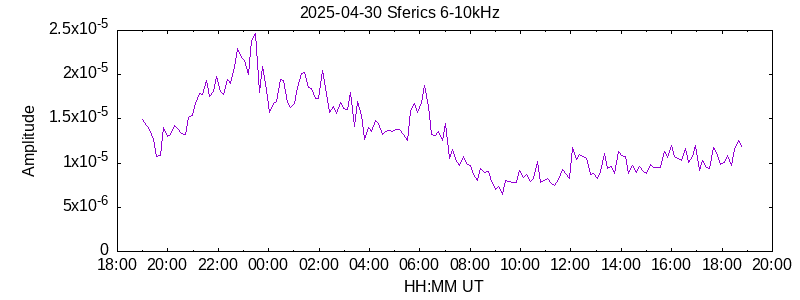
A multichannel receiver continuously monitoring the signal strength of five VLF stations, each shown on a seperate plot, together with a plot of sferics in the range 6 - 10 kHz.
For more details on the instruments click here.
For a page showing plots for yesterday and today click here.
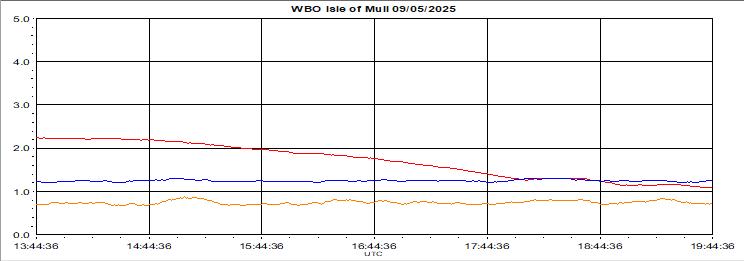
SID Receiver 23.4 kHz and Muon Counts
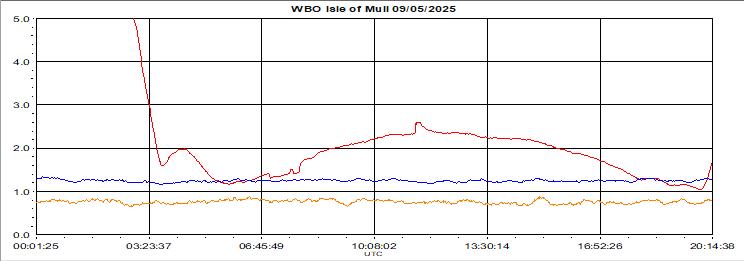
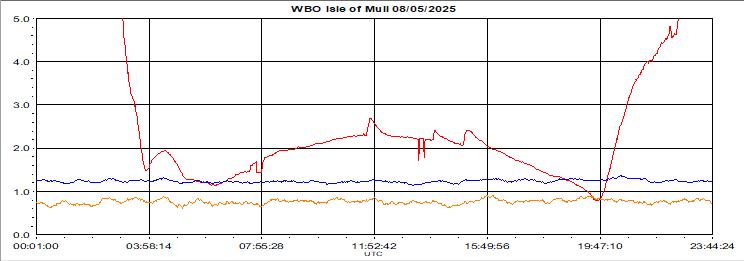
Signal strength of DHO in RED, arbitary units, 0 - 5.0
Muon count in ORANGE, 30 min rolling average, scale 0 - 50 cpm.
Background count in BLUE, 30 min rolling average, scale 0 - 250 cpm
The first plot is for the last 6h.
Below that are full 24h wide charts for the current and previous day.
For more details on the instruments click here.
Comments or suggestions for
changes are welcome.
Please send them to me
at : marsport@marsport.org.uk
 Return to Observatory Main Page